
Opal3 provides an API call that may be used to submit data to Opal3 from any of your source systems, for example as part of your normal overnight routines. Setting this up should be reasonably straightforward for a competent SysAdmin person. Please contact us if you need assistance.
To use this API call, you will need a valid username and password for your Opal3 site. We recommend that you create a dedicated user (e.g. "{YourSourceSystem} Loading System") for this, so that the audit pages clearly show where the data originates.
To submit non-financial data, you need to POST to the URL https://{yoursite}.opal3.com/api/1/load_data/. The POST data must include the following information in JSON format:
1. `username`
2. `password`
3. `financial` - must have the value `false`
4. `data` - a list of items, in this order, with none missing:
- A. `code` - this must match the "internal code" you have set in opal3 for an indicator (see this article).
- B. `month of financial year` - eg, 1 for the first month in your financial year, 12 for the last month in your financial year. If the reporting period is longer than 1 month, use the starting month. E.g., for quarterly indicators use Q1: 1, Q2: 4, Q3: 7, Q4: 10.
- C. `financial year end` - the calendar year in which the financial year ends
- D. `result` - the result, which depends on the indicator type, ie. it must be one of
- a number - for type = number or currency,
- a date - for type = date
- text - for type = text-2 fields or options
- a blank - for type = text-1 field, percentage or permillage.
E. `numerator`- the numerator, if type = percentage or permillage, otherwise blank
F. `denominator` - the denominator, if type = percentage or permillage, otherwise blank
G. `colour` - either `green`, `yellow`, or `red`, otherwise blank.
H. `data_source` – optional name of your data source system, if your site has this field activated
I. `comment` - optional commentary for the result
To submit financial data, you need to POST to the URL https://{yoursite}.opal3.com/api/2/load_data/. The POST data must include the following information in JSON format:
1. `username`
2. `password`
3. `financial` - must have the value `true`
4. `data` - a list of objects (maps, dictionaries) with these keys:
- A. [required] `code` - this must match the "internal code" you have set in opal3 for an indicator (see this article).
- B. [required] `month of financial year` - eg, 1 for the first month in your financial year, 12 for the last month in your financial year.
- C. [required] `financial year end` - the calendar year in which the financial year ends
- D. [optional] `budget`
- E. [optional] `actual`
- F. [optional] `forecast`
- G. [optional] `annual-budget`
You will receive back a JSON response from the API that includes the following information:
- `success_count` - the number of items that were successfully processed (e.g. if an indicator matching the code cannot be found, then that item will not be successful)
- `unchanged_count` - the number of items that did not result in any change (e.g. you have already provided information for this indicator & period combination)
- `unique_indicator_count` - the number of unique indicators that were processed
- `failures` - a map of the list index to an error message describing the problem (e.g. "Cannot find matching indicator') with that item.
Code Examples
Using Python and the requests library, you can submit data as follows. Please contact us if you need us to provide you with an example in a language other than Python.
Example for a non-financial component (percentage)
>>> data = {"username": "yyyyyyy", "password": "xxxxxxxx", "financial": False, "data": [("nfcode1", 8, 2020, None, 50, 100, "yellow", None, " Expected to increase to 65 percent next quarter.")]}
>>> requests.post("https://{your site}.opal3.com/api/1/load_data/", json=data).json()
{u'success_count': 1, u'unchanged_count': 0, u'unique_indicator_count': 1, u'failures': {}}
>>> requests.post("https://{your site}.opal3.com/api/1/load_data/", json=data).json()
{u'success_count': 0, u'unchanged_count': 1, u'unique_indicator_count': 1, u'failures': {}}
Assuming the financial year starts in July, then this will add data for the indicator with code nfcode1 for the month February 2020, setting the numerator to 50, the denominator to 100 (and therefore the value to 50%, automatically), with a yellow traffic light colour, no data source, and a comment about expected future improvement. The response shows that the data was processed successfully. The second response shows that there was one item that did not result in a change (because the data was the same).
Note that, if you only provide numbers but no colour choice or comment via the API and if an indicator is
- set to “silent”, the colour will be set to “green” and the comment to “Auto populated.”
- not set to “silent”, the colour and comment will be left to the owner of the indicator to provide manually via the normal process.
Example for a financial component
>>> username = "xxxxxxxx"
>>> password = "xxxxxxxx"
>>> values = [{"budget": 500000, "actual": 470000, "code": "fcode2", "year": 2021, "month": 1}]
>>> requests.post("https://{your site}.opal3.com/api/2/load_data/", json={"username": username, "password": password, "financial": True, "data": values})
{u'success_count': 1, u'unchanged_count': 0, u'unique_indicator_count': 1, u'failures': {}}
>>> requests.post("https://{your site}.opal3.com/api/2/load_data/", json=data).json()
{u'success_count': 0, u'unchanged_count': 1, u'unique_indicator_count': 1, u'failures': {}}
Assuming your financial year starts in July, then this will add data for the indicator with code = fcode2 for the month of July 2020, setting the budget value to $500,000, the actual value to 470,000, and therefore the variance to $30,000 and 6% under budget.
Note that, if the colour criteria are set, the appropriate colour will be assigned automatically and, if the indicator is classified as “silent” the comment will be set to “Auto populated”. If either of those two components are missing, the owner of the indicator will be required to provide that information in due time.
Possible Error Messages (explanation in brackets)
"You must provide a JSON body."
"Missing data." (Using v1, wrong number of items in a data row; using v2, missing code, month, or year items).
"Cannot find matching indicator" (code doesn't match any indicator).
"Two indicators match this code" (two indicators have the same code).
"This indicator rolls up underlying data" (Opal3 is set to roll up contributing data from lower level indicators).
"This type of indicator cannot be updated using the API" (it's a "highlight" indicator).
"This period is not available for reporting"
Success Response (key/values, explanation in brackets)
"success_count" (positive integer indicating the number of rows successfully processed, with changes).
"unchanged_count" (positive integer indicating the number of rows with no problems but where the data did not change - not necessarily an error, e.g. when resubmitting data).
"unique_indicator_count" (positive integer, presumably obvious).
"failures" (object mapping row number to failure messages).
A fully worked generic example for loading financial data from a csv file
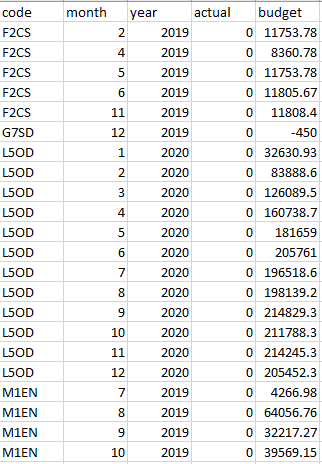
Example csv file:
Example script:
Note that, instead of Python you can use more or less any language (eg, PowerShell, curl, C#, Java, JS, etc). We do expect JSON, because that's the standard everywhere, but whatever language you're using most likely has functionality that lets you easily get data into JSON from wherever it starts (a CSV file or DB, etc).
#! /usr/bin/env python

"""Basic script to load data from a CSV file into opal3.

Requires:

 * Python 3: https://python.org
 * requests: https://requests.readthedocs.io/
 * click: https://click.palletsprojects.com/

Assumes input will be a CSV file that has the following header row:

code,year,month,budget,actual

(note that these are case sensitive, ie. should be all lowercase).
And then subsequent rows have values for those columns.

For more information, run with --help.
"""

# These are in the standard library, so are included with the Python install.
import csv
import itertools

# These are separately installed. The script could be made to work without
# them, but they make it simpler & easier to read and maintain.
import click

import requests

# This makes it possible do use "--help" and other common functionality.
@click.command()
# For testing purposes, allow specifying the site to load into.
# For example, you could provide "orc-training" instead.
@click.option("--site", default="orc")
# Do the work in chunks of this size.
@click.option("--chunk-size", default=100)
# Credentials are ideally located in the environment, but could also be
# passed to the script as part of the execution command.
@click.option("--username", default="finance_loader", envvar="OPAL3_USERNAME")
@click.option("--password", prompt=True, hide_input=True, envvar="OPAL3_PASSWORD")
# This is where we will get the data from. This supports standard practice
# like using "-" to mean stdin.
@click.argument("input", type=click.File("r"))
def load(site, username, password, input, chunk_size):
    """Load data from the provided CSV file into opal3."""
    # Parse the provided file as a CSV file.
    # We use a DictReader so that it reads the first line and uses that to
    # figure out what columns there are. This also means that if the columns
    # are in a different order, everything will still work.
    reader = csv.DictReader(input)
    # Collect the information to send.
    values = []
    for row in reader:
        # We need to convert these to a number. JSON cannot handle decimals,
        # so use a float instead.
        budget = float(row["budget"])
        actual = float(row["actual"])
        # These also need to be numbers, but are integers.
        year = int(row["year"])
        month = int(row["month"])
        values.append(
            {
                "code": row["code"],
                "year": year,
                "month": month,
                "budget": budget,
                "actual": actual,
            }
        )
    click.echo(f"Loaded {len(values)} rows to send to opal3.")
    # Send the data to opal3.
    # We do this in chunks to avoid hitting any timeout when there is a lot
    # of data.
    accumulated_successes = 0
    row_count = 1  # Convert from 0-based to 1-based.
    # The complicated looking code here just breaks the "values" list
    # into lists of "chunk_size" size. islice slices up the original list,
    # and iter will stop when it gets to the "sentinel" value, which is the
    # empty list.
    values = iter(values)
    for chunk in iter(lambda: list(itertools.islice(values, chunk_size)), []):
        response = requests.post(
            f"https://{site}.opal3.com/api/2/load_data/",
            json={
                "username": username,
                "password": password,
                "financial": True,
                "data": chunk,
                }
        )
        # Output/collate information from the response.
        if response.ok:
            answer = response.json()
            accumulated_successes += int(answer["success_count"])
        else:
            click.echo(f"Error from opal3 API: {response.text}")
        # If there are failures, give information about those.
        for row_num, details in sorted(answer["failures"].items()):
            # Adjust the row number to reflect that this is one chunk.
            row_num = int(row_num) + row_count
            click.echo(f"Error on row {row_num}: {details}")
        row_count += len(chunk)
    click.echo(f"Successfully loaded {accumulated_successes} indicators.")


# This tells Python that if this file is executed, then it should run the
# "load()" method.
if __name__ == "__main__":
    load()